
Most merchants track approval rates, but very few understand why their payments fail and almost none analyse declines at the level where banks actually make decisions: by BIN range, issuer, and geography. In 2026, this lack of visibility costs high-risk and cross-border merchants millions in lost revenue every year. Declines that look random are rarely random. They are tied to issuer risk scoring, corridor rules, authentication design, or simply the wrong routing path.
Payment funnels have also become more complex. Customers now move across multiple payment rails, authentication flows and device types. A single failed transaction may have failed because of friction in 3DS, routing misalignment, poor issuer sentiment, or behavioural risk signals, not because of the card itself. Without a proper funnel intelligence framework, merchants misinterpret these signals and take the wrong corrective action.
As PSD3, new issuer transparency rules, and global authentication changes reshape payment expectations, merchants must adopt a more forensic approach. Funnel intelligence allows them to benchmark every step from authorisation to 3DS to issuer response so they can pinpoint exactly where performance breaks down. Instead of treating declines as a cost of doing business, merchants can identify which BINs convert poorly, which issuers automatically challenge, and which regions need tailored routing.In high-risk and cross-border environments especially, understanding the funnel is no longer an optimisation feature it is a survival requirement. Merchants who rely on overall approval numbers will continue to lose revenue quietly. Those who monitor their funnel with precision will unlock higher approvals, lower costs, and more predictable performance across every market they operate in.
- Building a Modern Payment Funnel Framework (2026 Edition)
- BIN-Level Performance Mapping: The Most Underused Payment Lever
- Issuer-Specific Intelligence: Understanding Bank Behaviour Patterns
- 3DS2 Funnel Drop-Off Measurement: Where Merchants Lose the Most Money
- Geographic Performance Disparities: Why Corridors Behave Differently
- Creating Merchant Benchmarks: The 2026 Standard Analytics Model
- Using Funnel Data Inside Smart Routing Engines
- Conclusion
- FAQs
Building a Modern Payment Funnel Framework (2026 Edition)
A modern payment funnel is no longer a simple “attempt → approval or decline” sequence. In 2026, funnels are multi-layered decision journeys shaped by authentication rules, issuer sentiment, routing logic, fraud scoring and device behaviour. Understanding this journey is the first step toward meaningful optimisation because merchants can’t improve what they can’t see.
A good funnel framework shows not only where a transaction drops but why it drops. It breaks the payment journey into measurable checkpoints and helps identify friction clusters that traditional dashboards overlook.
Mapping the Funnel End-to-End
A 2026 payment funnel typically includes the following stages:
- Risk & Fraud Screening
Transaction is evaluated by merchant risk engines and PSP fraud models. - 3DS / Authentication Step
Depending on SCA rules, issuer policy and RBA scoring, the transaction may:- Go frictionless
- Enter a challenge
- Fail due to timeout or SDK issues
- Issuer Decision
The bank evaluates the payload, device reputation, BIN history, merchant credibility and corridor-specific risk.
This breakdown reveals where bottlenecks hide. For many merchants, the biggest losses come from authentication drop-offs or issuer-side risk scoring, not from fraud itself.
The Data Layers Required for Accurate Funnel Intelligence
To benchmark declines and friction properly, merchants need a layered dataset that includes:
- BIN range (6-8 digits)
Helps identify issuer behaviour patterns, forced 3DS and approval swings. - Issuer-level granularity
Necessary to understand soft declines, RBA triggers, and authentication policies. - Geography / corridor data
Required for detecting regional friction and SCA differences. - Device & channel information
App, mobile web, desktop and SDK performance behave differently. - 3DS version & method
(frictionless, challenge, delegated authentication, fallback). - PSP & acquirer routing paths
Needed to see which provider performs best for which BIN/issuer pair.
Without these layers, merchants are essentially guessing which is why many incorrectly blame the wrong part of the funnel when performance drops.
BIN-Level Performance Mapping: The Most Underused Payment Lever
Most merchants know their overall approval rate. Very few know which BIN ranges are causing those approvals to drop. In 2026, BIN-level intelligence has become one of the most powerful ways to diagnose and fix performance issues primarily because issuers no longer behave uniformly. They tailor authentication rules, fraud thresholds and routing preferences based on the BIN’s history, geography and risk profile.
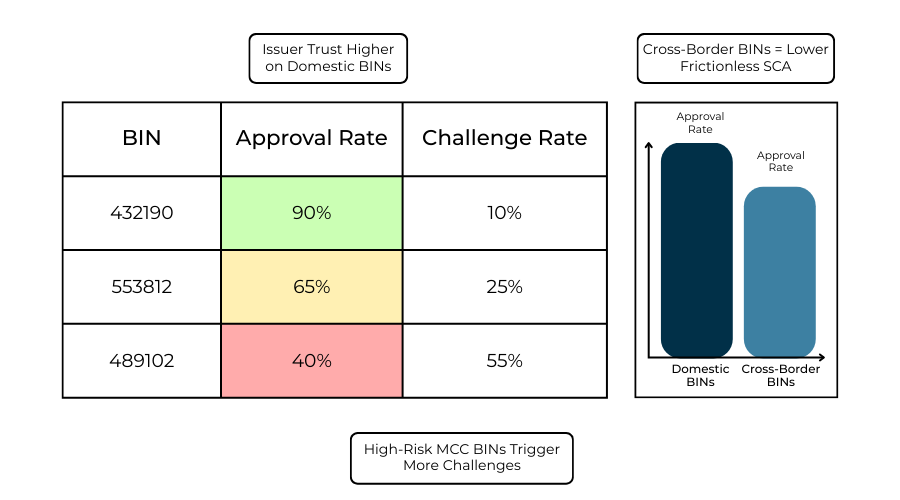
When a merchant analyses performance by BIN, patterns start to reveal themselves quickly. For instance, some domestic BINs in the EU reliably offer frictionless SCA, while certain cross-border BINs trigger mandatory 3DS challenges every time. A BIN from a high-risk jurisdiction may receive more risk-based declines, even if the customer is genuine. And in many corridors, BINs tied to digital-only banks behave differently from BINs tied to traditional banks.
Ignoring this level of granularity means merchants respond incorrectly to declines often adjusting checkout UX or retry logic when the issue is actually issuer sentiment tied to specific BINs.
Why BIN-Level Mapping Matters in 2026
Several shifts make this especially important today:
- Issuer risk scoring has become BIN-sensitive. Under PSD3 and global fraud mandates, issuers categorise some BINs as higher-risk by default.
- Tokenisation maturity varies by BIN. Some issuers approve network tokens at higher rates than PAN transactions.
- Cross-border BINs frequently trigger extra friction. Especially in LATAM, GCC and APAC corridors.
- High-risk MCCs face BIN-specific throttling. Some BINs decline more aggressively due to sector patterns, not merchant behaviour.
These patterns only appear when merchants benchmark BINs independently rather than merging everything into a single approval number.
Domestic vs Cross-Border BIN Behaviour
A domestic BIN (customer and issuer in the same country) almost always performs better because:
- Issuers recognise local BINs instantly
- RBA scoring favours familiar patterns
- SCA signals are easier to validate
- Fewer FX and cross-border checks take place
But cross-border BINs especially in high-risk verticals often experience:
- Higher forced 3DS rates
- More “do not honour” declines
- Additional issuer fraud checks
- Lower tolerance for velocity or mismatched device details
Understanding which BINs consistently show friction helps merchants adjust routing, authentication strategy and retry logic precisely where it matters.
Issuer-Specific Intelligence: Understanding Bank Behaviour Patterns
Even when two customers share the same card network, the same country, and the same checkout experience, their issuing banks may behave very differently. In 2026, issuer behaviour has become one of the strongest predictors of approval rates, 3DS friction, and soft-decline patterns. This is because issuers now apply advanced risk scoring models, corridor rules, authentication logic and transaction monitoring frameworks that differ widely across regions and sometimes even across BIN ranges of the same bank.
Merchants that analyse issuer performance as a single metric miss these important nuances. The real value lies in understanding which issuers consistently challenge, decline or downgrade transactions and why.
Recurring Soft Declines: The Hidden Insight Layer
Many issuers generate similar soft-decline patterns that reveal how they classify risk. These declines are not outright rejections; they indicate what the issuer needs to approve a transaction.
Typical recurring soft declines include:
- Do Not Honour: Often triggered when issuer RBA flags unusual behavioural or geo signals.
- Authentication Required: The issuer wants stronger SCA; routing or 3DS method may be misaligned.
- Insufficient Authentication Data: Indicates weak 3DS request payloads, not fraud.
- Restricted Transaction: More common with cross-border issuers or high-risk MCCs.
If merchants only consider these as generic declines, they lose the opportunity to adjust the funnel. But when analysed per issuer, patterns become actionable. For example, some issuers almost always accept a retry with tokenised credentials, while others prefer a different acquirer route.
RBA (Risk-Based Authentication) Variations by Issuer
Risk-Based Authentication (RBA) drives most 3DS behaviour today. Two customers at two different issuers may get:
- A fully frictionless flow
- A challenge with step-up verification
- A forced decline if the issuer believes the transaction cannot be trusted
Issuers make these decisions based on:
- Customer history
- Device consistency
- Transaction amount
- BIN reputation
- MCC risk level
- Corridor patterns
Some EU issuers routinely challenge high-value transactions even when SCA exemptions apply, while certain LATAM issuers override merchant-initiated exemptions due to higher fraud exposure. GCC issuers often challenge cross-border traffic more aggressively, whereas many APAC issuers rely heavily on behavioural scoring and device trust signals.
Understanding these differences allows merchants to predict friction before it occurs and design checkout flows that reduce the probability of a challenge.
3DS2 Funnel Drop-Off Measurement: Where Merchants Lose the Most Money
For many merchants, 3DS2 is the single largest source of hidden conversion loss. Even when customers are legitimate, 3DS challenges, timeouts or failed authentications can cause abandonment long before the issuer makes a decision. In 2026, understanding the 3DS funnel is essential because authentication has shifted from being a compliance requirement to being a performance driver.
Most merchants look only at the final 3DS result approved or failed. But the real insights come from examining each step of the authentication path and identifying where customers drop off or where issuers create unnecessary friction.
Challenge Rates and When They Become a Problem
Challenge rates vary significantly across issuers and corridors. A high challenge rate usually means one of three things:
- The issuer’s RBA scoring does not trust the data being provided.
- The merchant’s 3DS request includes weak or incomplete metadata.
- The corridor (e.g., GCC or LATAM) has higher fraud pressure.
Challenges are not inherently negative; they ensure security. But when challenge rates exceed 20-30% for specific BINs or issuers, abandonment rises sharply.
Abandonment by Device and Channel
Device performance differences are stark:
- Mobile browser transactions experience the highest abandonment due to UI disruptions and redirects.
- Apps generally perform better, but SDK version mismatches can cause unexpected failures.
If merchants do not separate abandonment metrics by device, they risk misdiagnosing the problem as issuer-related when it is actually UX-driven.
Timeouts, Failures and SDK Issues
Timeouts often reflect:
- Slow issuer ACS (Access Control Server)
- PSP-level latency
- Device/browser incompatibility
- Poor network conditions in certain geographies
These failures do not show up as declines in the issuer report; they appear as customer drop-offs, making them harder to track without a structured funnel.
Merchants who measure only successful authentications lose visibility into these failures, even though they may represent 5-12% of all lost conversions in high-friction corridors.
Why 3DS Data Quality Matters More in 2026
Issuers rely heavily on the metadata passed in the 3DS request to determine risk level. Missing fields, such as device ID, account age, address data or behavioural signals lead to unnecessary challenges.
Merchants who optimise their 3DS payloads often see:
- Higher frictionless rates
- Lower challenge volume
- Reduced false declines
- Better issuer trust over time
In 2026, authentication performance is not only about complying with SCA rules; it is about giving issuers enough confidence to approve.
Geographic Performance Disparities: Why Corridors Behave Differently
A well-performing payment funnel in one market can perform poorly in another, even with the same checkout, same acquirer and same customer behaviour. This is because issuers across regions apply different fraud models, authentication thresholds and risk expectations. In 2026, merchants expanding globally must understand that geography is not just a variable, it is a performance driver.
Several regions now operate with distinct standards for authentication, routing and issuer risk scoring. Benchmarking performance without separating corridors leads to misleading conclusions that hurt optimisation decisions.
European Union: High SCA Burden but Predictable Behaviour
EU issuers operate under PSD2 and the upcoming PSD3/PSR reforms, making authentication rules stricter but more consistent.
Common characteristics:
- Higher frictionless rates when data quality is strong
- Strict enforcement of SCA
- Lower tolerance for missing metadata
- Stable issuer scoring due to unified regulation
Merchants often see reliable performance here if their authentication flows are well structured.
LATAM: High Wallet Penetration and Tougher Card Risk Controls
LATAM issuers face higher fraud pressure, especially for cross-border transactions.
Patterns often include:
- Higher challenge and decline rates
- Issuers mistrusting foreign BINs
- Strong preference for local APMs such as Pix and SPEI
- Lower success on 3DS unless fully optimised
In this region, card success often improves only when merchants diversify into local rails.
GCC: Manual Review Culture and Cautious Issuer Scoring
Gulf Cooperation Council issuers tend to apply conservative fraud models, especially for high-risk MCCs. Expect:
- Higher manual review queues
- Increased delays in 3DS challenge handling
- Stricter checks for cross-border traffic
- Unpredictable issuer friction during peak hours
Merchants operating here must ensure their routing and authentication data quality are robust.
Africa: Infrastructure Variability and Mobile-First Behaviours
Africa’s growing digital payments ecosystem is healthy but fragmented.
Common observations:
- Variability in ACS performance
- Strong adoption of mobile-money rails
- Higher drop-off during redirects or poor connectivity
- Lower tolerance for high-value cross-border card traffic
Routing and 3DS strategies must account for infrastructure challenges.
APAC: Wallet-Dominant, High-Speed, Device-Focused Markets
Asian markets especially Southeast Asia rely heavily on QR wallets and instant A2A systems.
Card patterns typically include:
- High abandonment for browser-based challenges
- Strong issuer reliance on behavioural scoring
- Device continuity being a major approval factor
- Differences between domestic and international card rails
Performance improves dramatically when merchants offer local payment alternatives.
Creating Merchant Benchmarks: The 2026 Standard Analytics Model
Most merchants know their approval rate, but few know whether that number is good or bad within their vertical, geography or BIN mix. In 2026, benchmarking has become a core part of payment optimisation because raw metrics without context lead to wrong assumptions. A 78% approval rate in Brazil may be excellent; the same number in France might indicate a serious authentication issue. Funnel intelligence only becomes actionable when merchants compare their performance against meaningful standards.
Modern benchmarks focus not just on approvals, but on every part of the payment journey: authentication friction, issuer behaviour, routing efficiency and the true cost of acceptance. When these benchmarks are tracked consistently, merchants gain a clear view of where they outperform the market and where they are losing margin.
The Metrics That Matter in 2026
Benchmarks must go beyond surface-level data. The most valuable metrics include:
- Approval Rate % (by BIN, issuer, corridor): The baseline measure of performance quality, but only meaningful when segmented.
- Cost per Accepted Transaction: Takes into account interchange, scheme fees, FX, acquirer markup and routing path.
- Chargeback-Adjusted Acceptance: A critical metric for high-risk sectors, high approvals mean nothing if chargebacks spike later.
- 3DS Friction Rate: Percentage of transactions that enter challenge, timeout or fail during authentication.
- Authentication Success Rate by Device: Reveals differences between app, web and mobile flows.
- Issuer Soft-Decline Ratio: Helps detect which issuers require improved data or alternative routing.
- Routing Efficiency Score: Measures whether the right acquirer is being used for each BIN or corridor.
By measuring these consistently, merchants build an internal performance baseline that highlights where optimisation has the highest impact.
Benchmarking Against the Right Comparisons
A metric is only useful when compared correctly.
In 2026, merchants typically benchmark their funnel against three layers:
- Historical Performance (You vs You)
Reveals improvements or regressions caused by product, routing or user behaviour changes. - Market/Corridor Averages
Shows whether performance issues are merchant-specific or environment-driven.
Example: If many issuers in a region are applying stricter RBA, a sudden challenge spike may not be a merchant error. - Acquirer/PSP Averages (Internal or via Orchestration)
Helps identify which acquirer performs best for each BIN or country.
This multi-layer comparison prevents misdiagnosis. A sudden approval drop might appear to be fraud-related, but a benchmarked analysis could reveal an issuer outage, a corridor SCA change or a PSP latency spike.
Why Benchmarks Matter More for High-Risk Verticals
Sectors like gaming, travel, forex, digital entertainment and ticketing experience more volatility in issuer sentiment. Without benchmarks, merchants cannot separate real performance issues from expected fluctuations.
A well-structured benchmark is essentially a diagnostic tool: it turns the payment funnel from a black box into an intelligent performance map.
Using Funnel Data Inside Smart Routing Engines
Routing used to be simple: send the transaction to the default acquirer and retry if it fails. In 2026, that approach is no longer viable. Issuer behaviour shifts by the hour, corridors have different authentication expectations, and acquirer performance varies based on load, risk filters and regional rules. The result is that the “best” route for a transaction is not fixed, it changes constantly.
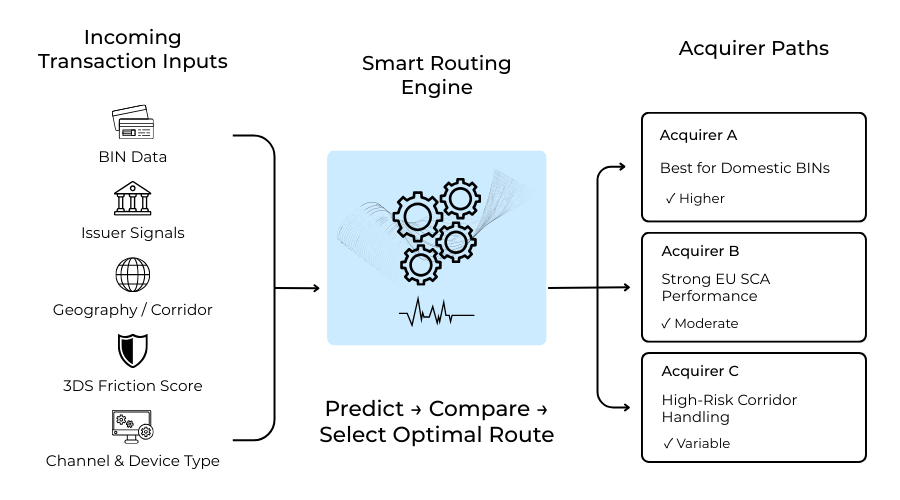
Smart routing engines now rely on real-time funnel intelligence to decide where each transaction should go. Instead of routing based on averages, the system evaluates BIN trends, issuer friction, 3DS behaviour and corridor performance to determine the path most likely to produce an approval. This transforms routing from a static configuration into a dynamic optimisation engine.
BIN → Acquirer Matching
One of the highest-impact routing strategies is matching specific BINs to acquirers that historically perform better with those issuer ranges. Some acquirers have stronger issuer relationships in certain regions, while others excel at processing domestic traffic or handling high-risk MCCs. Routing engines can learn these patterns over time.
Examples include:
- Certain EU acquirers delivering better frictionless SCA for domestic BINs
- LATAM-focused acquirers handling Brazilian BINs with fewer challenges
- GCC acquirers improving approval rates for high-friction cross-border BINs
This level of precision is only possible when merchants track approval and friction metrics at BIN granularity.
Issuer → Authentication Strategy
Issuers respond very differently to 3DS data and exemptions. Funnel intelligence helps routing engines decide when to:
- Attempt frictionless flows
- Trigger exemptions
- Avoid exemptions for specific issuers
- Strengthen the 3DS payload
- Adjust challenge expectations by corridor
For example, if a particular issuer consistently rejects frictionless attempts, routing engines can automatically switch to a challenge-first approach to avoid repeated declines.
Region → Routing Path Adjustments
Geography heavily influences routing logic.
Examples:
- EU corridors demand high-quality SCA data and often penalise incomplete metadata.
- LATAM regions favour domestic routing and may distrust foreign acquirers.
- APAC issuers may prefer certain PSPs that send strong behavioural and device information.
- GCC corridors often benefit from acquirers that can manage manual review flows effectively.
Routing engines use funnel data to shape corridor-specific logic that blends compliance with performance.
Issuer Health Monitoring in Real Time
Advanced routing layers now track issuer outages, authentication degradation and soft-decline spikes. When an issuer experiences temporary friction, the system can:
- Automatically re-route to alternative acquirers
- Adjust authentication flows
- Delay retries until the issuer stabilises
This prevents unnecessary declines and reduces customer frustration during periods of issuer instability.
Turning Funnel Intelligence Into Revenue
When real-time data guides routing, merchants typically experience:
- Higher approval rates
- Fewer authentication failures
- Lower issuer friction
- Reduced operational cost per accepted transaction
In high-risk verticals, these gains compound into significant revenue uplift.
Conclusion
In 2026, merchants cannot afford to rely on surface-level approval metrics or generic decline reports. Issuers, regulators and payment rails have become more complex, and performance now depends on granular factors such as BIN-level behaviour, issuer risk models, corridor-specific authentication patterns and routing alignment. Without a structured funnel intelligence model, merchants are essentially operating blind unable to distinguish technical friction from issuer-driven friction, or authentication failures from routing mismatches.
The merchants who succeed in high-risk and cross-border environments are those who analyse the funnel step by step: where friction enters, where issuers impose extra checks, which BINs need tailored routing and which geographies require a different authentication strategy. By transforming these insights into real-time routing rules and benchmark-driven decision-making, businesses can lift approvals, reduce cost per accepted transaction and improve customer trust.
Ultimately, funnel intelligence is not just a tool for optimisation teams. It is a competitive advantage that shapes how merchants grow, scale and protect their bottom line. As payments become more regionalised and issuers become more data-driven, the merchants who understand their funnel best will be the ones who perform best.
FAQs
1. What is payment funnel intelligence?
Payment funnel intelligence is the process of analysing every step of the payment journey from authorisation to authentication to issuer decision to identify where friction, declines or technical failures occur. It helps merchants understand why transactions fail, not just how often they fail.
2. Why is BIN-level analysis important in 2026?
Issuer behaviour varies widely by BIN. Some BINs trigger forced 3DS, while others receive smoother authentication or higher approval rates. Mapping performance by BIN allows merchants to optimise routing, adjust authentication flows and predict where friction will occur.
3. How does issuer-specific intelligence improve approval rates?
Different issuers apply different risk thresholds, SCA rules and authentication preferences. By tracking soft declines, challenge patterns and issuer reactions to exemptions, merchants can tailor authentication data or routing paths to match issuer expectations.
4. Why do 3DS challenges cause so much abandonment?
3DS introduces extra steps, redirects or verification screens. Users often abandon during challenges especially on mobile browsers. Timeouts, SDK errors and slow issuer ACS systems also contribute to drop-offs that merchants may mistake for declines.
5. How do geographic differences influence approval rates?
Regions apply different authentication rules, fraud models and issuer practices.
For example:
- EU is strict but predictable due to SCA rules
- LATAM issuers mistrust foreign BINs
- GCC issuers apply heavy manual review
- APAC emphasises behavioural/device trust
Understanding these distinctions helps merchants adapt their funnel to each region.
6. What benchmarks should merchants track in 2026?
The most important benchmarks include approval rate by BIN/issuer/geography, 3DS friction rate, device-level performance, cost per accepted transaction and chargeback-adjusted acceptance. Tracking these consistently reveals where optimisations can make the biggest impact.
7. How does smart routing use funnel intelligence?
Smart routing directs each transaction to the acquirer or PSP most likely to approve it based on BIN, issuer performance, corridor trends and authentication friction. It adapts dynamically whenever issuers, networks or acquirers experience performance shifts.
8. Can funnel intelligence reduce authentication friction?
Yes. By identifying issuers or regions with high challenge rates, merchants can strengthen data in the 3DS request, avoid unnecessary exemptions and align authentication strategy with issuer preferences leading to more frictionless approvals.
9. How does this help high-risk merchants specifically?
High-risk verticals face tighter issuer thresholds, more manual reviews and higher fraud controls. Funnel intelligence helps these merchants target improvements precisely where issuers are applying the most friction boosting approvals without raising risk.
10. Is funnel intelligence useful for cross-border merchants?
Absolutely. Cross-border flows are prone to additional issuer scrutiny, foreign BIN mistrust and corridor-specific authentication rules. Funnel intelligence helps merchants understand these patterns and adjust their routing or 3DS logic accordingly.
11. Does improving the funnel also reduce fraud?
Indirectly, yes. When merchants track behavioural anomalies, repeated soft declines or issuer risk signals, they can refine fraud scoring and authentication flows, preventing unnecessary declines without increasing fraud exposure.
12. How often should merchants review their payment funnel?
High-volume or high-risk merchants should review funnel intelligence daily, while others can evaluate weekly. Routing logic and authentication rules should update in real time when issuers or acquirers shift behaviour.